


![]() Wesdome Gold Mines (TSX: WDO)
Wesdome Gold Mines (TSX: WDO)
Achieved production of 25,142 ounces Au in Q2, which brings total H1 production to 50,264 ounces.
CEO Middlemiss is “confident on achieving our full year guidance of 90,000 oz Au”.
.
.
.
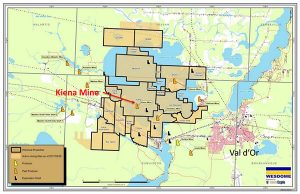
Wesdome Gold Mines Kiena Complex, Quebec
.
.
.
Wesdome Gold produces 25,142 oz of Au in Q2
2020-07-14 13:40 ET – News Release
Mr. Duncan Middlemiss reports
.
WESDOME ANNOUNCES 2020 SECOND QUARTER PRODUCTION OF 25,142 OUNCES OF GOLD PRODUCED
.
Wesdome Gold Mines Ltd. has released its gold production results for the second quarter of 2020. All figures are in Canadian dollars unless otherwise stated.
.
Mr. Duncan Middlemiss, President and CEO commented, “First and foremost I would like to thank our employees, contractors, and suppliers, without whose dedication and perseverance we would not succeed during these unprecedented times. Our second quarter production of 25,142 ounces brings total H1 production to 50,264 ounces, and we are confident on achieving our full year guidance of 90,000 to 100,000 ounces.
With the COVID-19 pandemic occurring at the end of Q1, and subsequent health and safety protocols immediately implemented, the mine was operating at a significantly reduced capacity, where we focused primarily on production and development, however had to cease our diamond drilling activities to allow for enhanced distancing in the Eagle River Camp. Production was better than anticipated due to increased ounces from the high grade 303 zone.
We are now at a point where we can begin to add diamond drills back into our plans and as such, we now are operating four drills, down from the seven drills we operated pre-pandemic. At Kiena, the Quebec government allowed for the resumption of activities in mid-May and we are now back to almost 100% drilling capacity at the Kiena Complex. Concurrent with the exploration drilling at Kiena, we are conducting the infill drilling to upgrade the resources in Q4 and this new resource will be used for the subsequent Pre-Feasibility Study to follow.”
.
 Amounts are denominated in Canadian dollars       Second Quarter                 Year-to-Date
                                              2020   2019 Variance% +/(-)    2020   2019 Variance% +/(-)

Ore milled (tonnes)
Eagle River                                 42,349 28,754 13,595   47%    98,223 59,695  38,528   65%
Mishi                                       13,721 18,623 -4,902  (26%)   24,768 37,093 -12,325  (33%)
                                            56,070 47,377  8,693   18%   122,991 96,788  26,203   27%

Head grade (grams per tonne, "g/t")
Eagle River                                   18.1   23.4   (5.3) (23%)     15.8   20.9    (5.1) (24%)
Mishi                                          2.9    3.0   (0.1)  (3%)      2.7    2.6     0.1    3%

Gold production (ounces)
Eagle River                                 24,117 20,873  3,244   16%    48,574 38,828   9,746   25%
Mishi                                        1,026  1,564   -538  (34%)    1,690  2,618    -928  (35%)
Total Gold Production                       25,142 22,437  2,705   12%    50,264 41,446   8,818   21%

Production sold (ounces)                    23,140 24,113   -973   (4%)   49,640 42,873   6,767   16%

Revenue from gold sales ($ millions)        $ 54.7  $42.2  $12.5   30%   $ 112.0  $74.7   $37.3   50%

Average realized price per ounce 2         $ 2,365 $1,752   $613   35%   $ 2,257 $1,743    $514   29%
.
.
Notes:
1. Operating numbers may not add due to rounding.
2. Average realised price per ounce is a non-IFRS performance measure and is calculated by dividing the revenue from gold sales by the number of ounces sold for a given period.
Technical Disclosure The technical content of this release has been compiled, reviewed and approved by Marc-Andre Pelletier, P. Eng, Chief Operating Officer, a “Qualified Person” as defined in National Instrument 43-101 -Standards of Disclosure for Mineral Projects.
,
ABOUT WESDOME
Wesdome Gold Mines has had over 30 years of continuous gold mining operations in Canada. The Company is 100% Canadian focused with a pipeline of projects in various stages of development. The Eagle River Complex in Wawa, Ontario is currently producing gold from two mines, the Eagle River Underground Mine and the Mishi Open pit, from a central mill. Wesdome is actively exploring its brownfields asset, the Kiena Complex in Val d’Or, Quebec. The Kiena Complex is a fully permitted former mine with a 930-metre shaft and 2,000 tonne-per-day mill. The Company has further upside at its Moss Lake gold deposit, located 100 kilometres west of Thunder Bay, Ontario.
/
The Company has approximately 138.8 million shares issued and outstanding and trades on the Toronto Stock Exchange under the symbol “WDO”.
.
We seek Safe Harbour.
.
.
.