


![]() Wesdome Gold Mines Ltd. {TSX: WDO}
Wesdome Gold Mines Ltd. {TSX: WDO}
Released positive results from the independent PEA prepared in accordance with National Instrument 43-101 at its 100-per-cent-owned Kiena complex in Val d’Or, Quebec. Canada.
.
.
.
,
,
27-05-2020 – News Release
Mr. Duncan Middlemiss reports
WESDOME DELIVERS A POSITIVE PEA AT THE KIENA COMPLEX IN VAL D’OR.
.
Wesdome Gold Mines Ltd. {TSX: WDO} has released positive results from the independent preliminary economic assessment (PEA) prepared in accordance with National Instrument 43-101 at its 100-per-cent-owned Kiena complex in Val d’Or, Que.
.
Highlights of the PEA:
- After-tax IRR of 102%
- After-tax NPV (discount rate 5%) $416 million
- Preproduction capital cost of $35 million
- Sustaining Life of Mine Capital Cost of $121 million
- After-tax payback period (after resumption of operations) 1.7 years
- Average diluted grade of 10.65 grams per tonne (“gpt”) based on current Kiena Mine Resource Estimate of September 2019
- Contained gold in Mined Resources: 709,000 ounces
- PEA Life of Mine of 8 years
- Total Unit Cash Operating Costs CDN$ 492 per ounce (US$374 per ounce)
- All-in sustaining costs CDN$674 per ounce (US$512 per ounce)
- Gold Price US$1,532 per ounce
- Exchange Rate: C$1.00:US$0.76
.
Duncan Middlemiss, President and CEO, commented, “We are pleased with the results of the PEA that clearly illustrates the viability to restart production at the Kiena Mine in a very short-term horizon. The PEA demonstrates a low-cost and high margin operation, with low capital requirements and a short payback period, while minimizing risks and maximizing shareholders’ return.
The Company is well-financed to advance the project to the next level with a cash position as of the end of the first quarter of $49.4M. This PEA is based on the Mineral Resource Estimate (‘MRE’) dated September 2019 and includes only those resources proximal to the mine infrastructure, specifically the A Zone, B Zone, S50, VC Zones and the South Zone. Diamond drilling activities at Kiena restarted on May 11th, focusing on the continuation of converting inferred into indicated resources, exploring the A zone up-plunge potential and expanding the resources at depth in the Kiena Deep A Zone.
The success of this drill program and drilling post September 2019, will further enhance the project economics outlined above. An updated resource estimate is planned early in Q4 2020 followed by a pre-feasibility study (‘PFS’) and a production restart decision in H1 2021. The COVID-19 pandemic has impacted our abilities to drill and develop at our full capacity, therefore this timeline includes contingencies until further information is available regarding the pandemic and necessary protocols going forward. Longer term, our focus will turn to the remaining resources on the Kiena property, which all together total 2.83M tonnes at 8.7 g/t for 788,000 ounces in the measured and indicated category, and 2.92M tonnes at 8.6 g/t for 798,000 ounces in the inferred category. There is certainly no lack of prospective targets.”
.
Overview
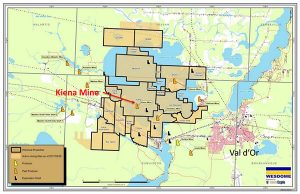
The Kiena Complex is in the Province of Quebec in the Abitibi-Temiscamingue administrative region within the limits of the municipality of Val d’Or and 100 km east of Rouyn-Noranda. It lies to the northwest of the urban centre of Val d’Or and covers 7,047 ha. The Project includes the milling and tailings facilities of the Kiena mine, nine shafts including the 930 metre (m”) Kiena shaft, related underground workings from past producers and exploration projects, various surface facilities and is fully permitted. Other than the exploration activities and underground exploration development, the principal infrastructure of the Project has been under care and maintenance since mid-2013. Past production from 1981 — 2013 was 12.5M tonnes at 4.5 g/t Au for 1.75 M ounces produced.
.
The Kiena Deep A Zone was first intersected in December 2007 and is localised within the Marbenite Fault (“MF”) deformation corridor and is divided into three main lenses and a fourth smaller lens.
.
Mineral Resources
The mineral resource estimate released on September 25, 2019 was used for the PEA. Only five out of thirteen zones that comprise the resources on the Kiena property were considered due to their proximity to the mine infrastructure.
.
Mining & Milling
Future mining will utilize the longhole mining method, and development will be performed utilizing standard development methods. Daily production rate commences at 450 tonnes per day (tpd) increasing to over 850 tpd. The overall strategy is to maximize throughput from the high grade Kiena Deep A Zone and to augment the production with the South, VC and the S50 and B Zones. Ore will be hauled by trucks to the shaft ore passes already established in the mine. Waste rock from development and approximately 38% of the tailings produced at the process plant will be returned to underground workings for backfilling purposes. The total ore mined by Zone is as follows:
.
.
Metallurgical test work undertaken by SGS has demonstrated the current cyanidation and carbon-in-pulp (CIP) mill circuit is well positioned to maximize the gold recovery of the five zones with a recovery averaging 97%. The installation of a free gold recovery circuit will be the subject of an optimization study included in the PFS.
.
Base Case
On an after-tax basis, the base case financial model resulted in an IRR of 102% and an NPV of $416.1M using a 5% discount rate with a Gold Price of US$1,532/oz at an exchange rate of C$1.00:US$0.76. The after-tax payback period after start of operations is 1.7 years.
.
The gold price used in the analysis was provided by an independent commodity specialist, CPM group. CPM Group is a commodities research, consulting, financial advisory and commodities management firm providing independent research, analysis and advisory services related to commodities markets, corporate and project finance, and the financial management of exposure to commodity-oriented investments. Analysts from CPM have been studying the gold market, along with other commodities markets, since 1980.
.
The pre-tax base case financial model resulted in an IRR of 126% and an NPV of $620.4M using a 5% discount rate. The pre-tax payback period after start of operations is 1.6 years.
,
The cash costs and all-in sustaining costs (AISC) over the LOM are US$374 and US$ 512/oz, respectively.
.
.
Capital and Operating Costs
The total pre-production capital cost for the Kiena Gold Project is estimated to be $43.7M including allowances for indirect costs and contingency of $2.7M and $2.9M respectively. A contingency of 25% was applied on some items where additional studies are required. The pre-production capital expenditures include refurbishments in the mine and the process plant, mine development, mining equipment, engineering, and field programs. There are $8.9M of sunk costs, which include pre-production mine development costs for the year 2020. Site reclamation and closure costs total $3M in addition to the existing $7M obligations ($1.5 in pre-production and $1.5 in sustaining cost).
.
The total sustaining capital cost for the project is estimated at $120.8M (not including exploration) including a $5.6M contingency. Mine sustaining costs of $92.8M consist of underground development, equipment purchases and construction work. A new tailings storage area (dry stacking deposition) combined with a new water treatment facility represent an expenditure of $16.6M.
.
The cumulative life of mine capital expenditure, including costs for pre-production and sustaining, is estimated to be $164.5M. The cumulative life of mine ‘Forecast to Spend’ amount, which includes reclamation and closure bonding costs and excludes sunk costs, is estimated to be $158.7M.
.
.
The average operating cost over the 8-year mine life is estimated to be $162.66/t mined.
.
.
Gold Production
The production plan is based on a mill start-up in H2 2021. Prior to which, ore sill production is planned in the first half of 2021, and will be stockpiled during this period. Each zone was reviewed, and a composite mining rate developed in tonnes per day (tpd) that accounts for sill development and the mining activities (drill, blast, muck and fill). Over the life of mine (LOM), a total of 687,449 oz of gold (payable) (average annual: 85,931 oz) will be produced.
.
Next Steps
The results of the PEA indicate that the proposed Project has technical and financial merit using the base case assumptions. It has also identified additional field work, metallurgical testwork, trade-off studies and analysis required to support more advanced mining studies. The QPs consider the PEA results sufficiently reliable and recommend that the Kiena Mine Complex Gold project be advanced to next stage of development through the initiation of a PFS.
.
An extensive work program including additional exploration drilling and the details of the pre-feasibility study has been developed based on QP recommendations. While the PEA is based on the Mineral Resource Estimate dated September 2019, an additional 47,800 m in 164 new drill holes completed since September 2019, will be included in the MRE to be updated early in Q4 2020. The updated mineral resource estimate will then be used as a basis for the PFS. It is intended that the PFS will be the basis for evaluating a construction decision to justify the mine restart.
.
Financial Analysis
A 5% discount rate was applied in calculating the Project’s NPV on a pre-tax and after-tax basis. Cash flows have been discounted to 2020 under the assumption that the Project will start in H1 2021. The summary of the financial evaluation for the PEA of the Project is presented in the table below:
.
.
The pre-tax base case financial model resulted in an IRR of 126% and an NPV of $620M with a discount rate of 5%. The pre-tax payback period after the start of operations is 1.6 years. On an after-tax basis, the base case financial model resulted in an IRR of 102% and an NPV of $416M with a discount rate of 5%. The after-tax payback period after the start of operations is 1.7 years.
.
Sensitivity
A financial sensitivity analysis was conducted on the PEA, after-tax NPV ($M) and IRR of the Project, using the following variables: capital costs, operating costs, USD:CAD exchange rate, price of gold and discount rate. The after-tax results for the Project IRR and NPV ($M) based on the sensitivity analysis are summarized below:
.
The sensitivity analysis reveals that the price of gold has the most significant influence on both the NPV and IRR compared to the other parameters, based on the range of values evaluated. After the price of gold, the NPV and IRR were most impacted by changes in the USD:CAD exchange rate and then, to a lesser extent, by variations in operating costs and capital costs. It should be noted that the economic viability of the Project will not be significantly impacted by variations in the capital or operating costs, within the margins of error associated with the PEA cost estimates.
.
Overall, the NPV and IRR of the Project are positive over the range of values used for the sensitivity analysis when analysed individually.
.
.
A conference call to discuss these results will be held on May 28 at 10:00 am ET. Wesdome invites participants to join the call using the following details:
Wesdome Gold Mines Kiena Preliminary Economic Assessment Conference Call
International Dial-In Number: 703-639-1272
Conference ID: 4389839
The full technical report Will be published on SEDAR and the Company’s website within 45 days of this announcement.
.
QUALIFIED PERSONS AND TECHNICAL INFORMATION
The reader is advised that the PEA Technical Report referenced in this press release is preliminary in nature and is intended to provide only an initial, high-level review of the Project potential and design options. Readers are encouraged to read the PEA Technical Report in its entirety, including all qualifications and assumptions. The PEA Technical Report is intended to be read as a whole, and sections should not be read or relied upon out of context. The PEA mine plan and economic model include numerous assumptions and the use of Inferred Resources. Inferred Resources are considered to be too speculative geologically to have the economic considerations applied to them that would enable them to be categorized as mineral reserves and to be used in an economic analysis except as allowed for by NI 43-101 in PEA studies. There is no guarantee that the PEA mine plan and economic model will be realized, and that Inferred Resources can be converted to Indicated or Measured Resources. Mineral resources that are not mineral reserves do not have demonstrated economic viability. As such, there is no guarantee the Project economics described herein will be achieved.
.
The Preliminary Economic Analysis production scenario is based on Indicated and Inferred resources from the Updated Mineral Resource Estimate (MRE) published on September 25th, 2019.
..
ABOUT WESDOME
Wesdome Gold Mines has had over 30 years of continuous gold mining operations in Canada. The Company is 100% Canadian focused with a pipeline of projects in various stages of development. The Company’s strategy is to build Canada’s next intermediate gold producer, producing 200,000+ ounces from two mines in Ontario and Quebec.
.
The Eagle River Complex in Wawa, Ontario is currently producing gold from two mines, the Eagle River Underground Mine and the Mishi Open pit, from a central mill. Wesdome is actively exploring its brownfields asset, the Kiena Complex in Val d’Or, Quebec. The Kiena Complex is a fully permitted former mine with a 930-metre shaft and 2,000 tonne-per-day mill. The Company has further upside at its Moss Lake gold deposit, located 100 kilometres west of Thunder Bay, Ontario.
.
We seek Safe Harbour.
.
.
.